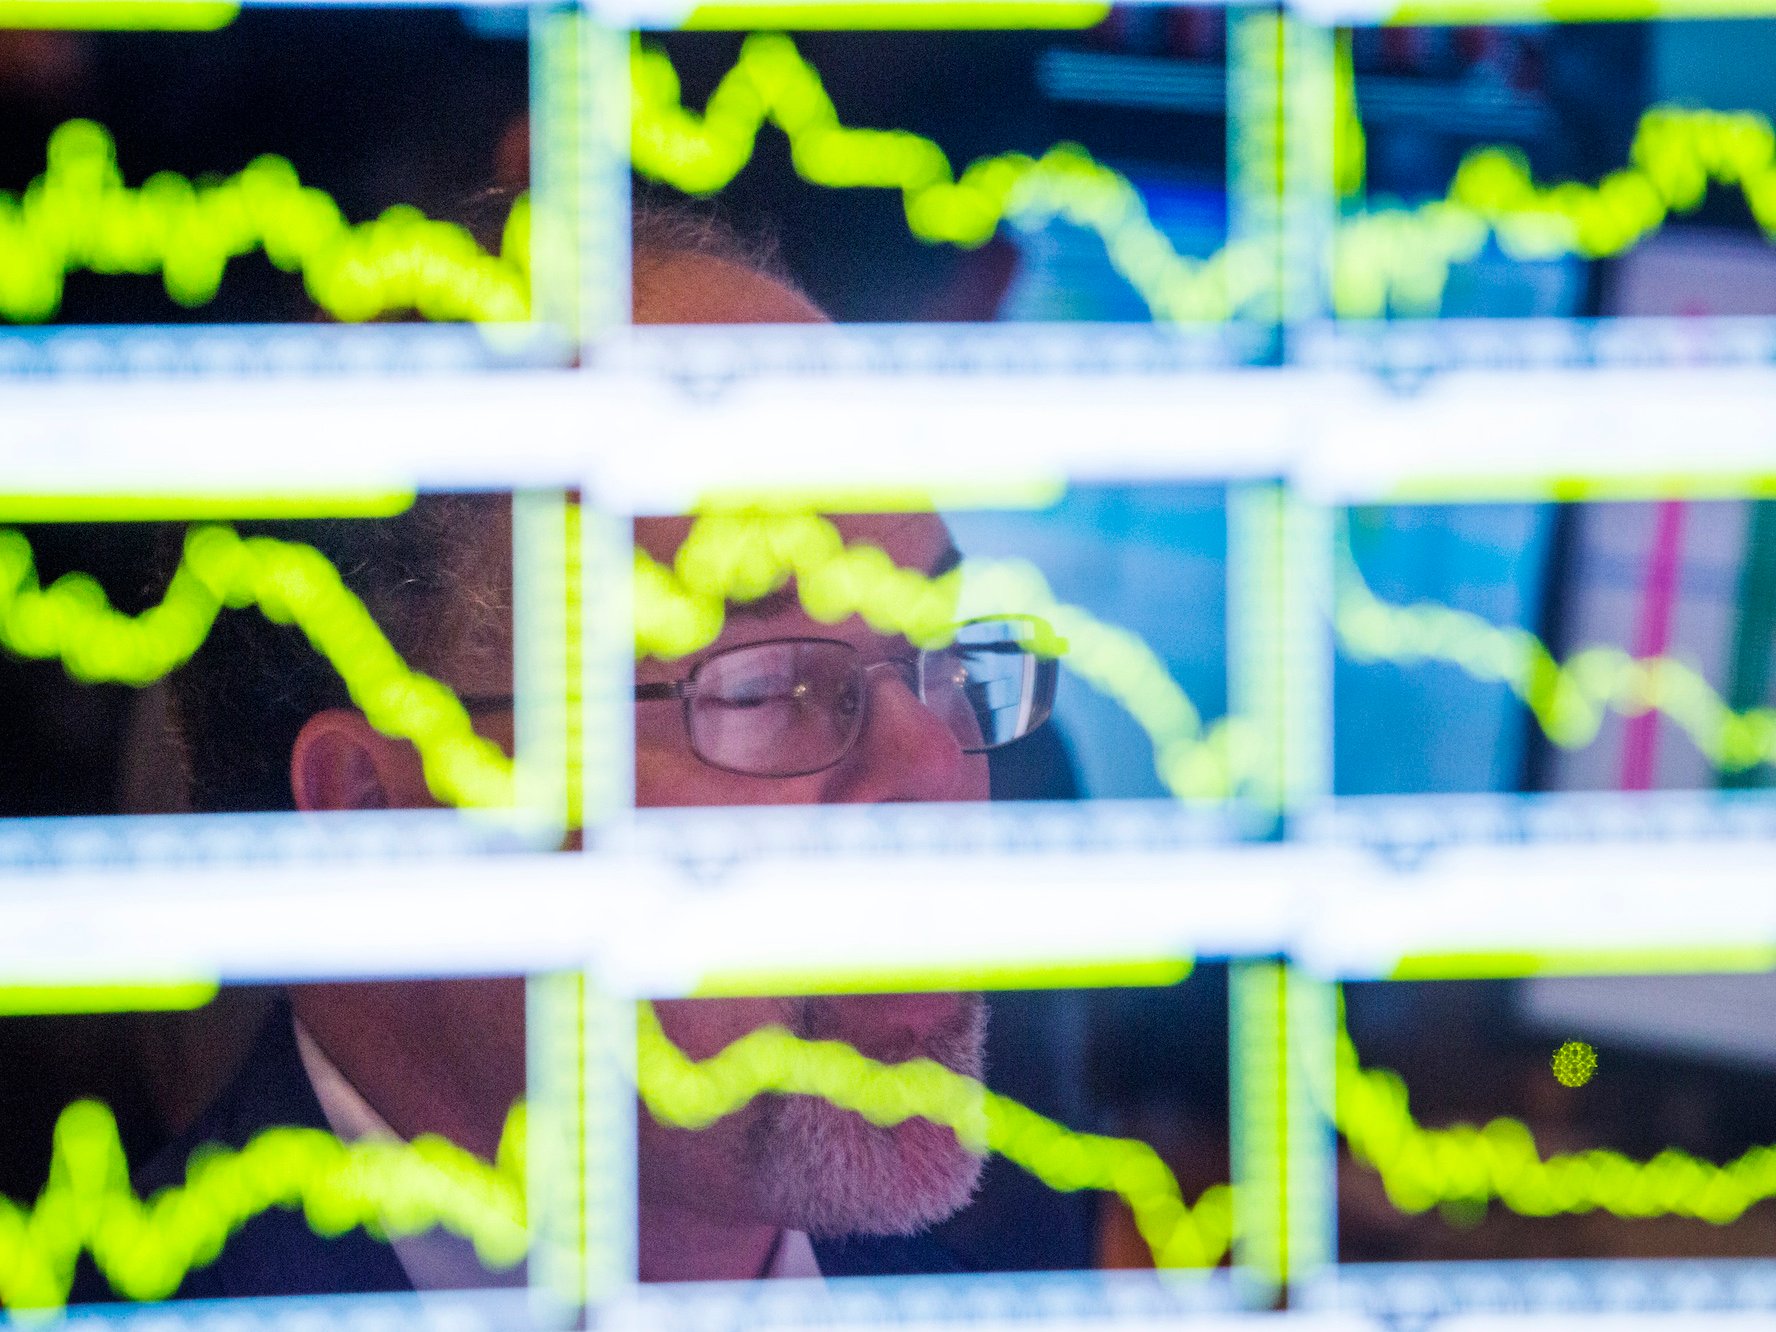
 A trader looks up at charts on his screen just before the end of trading for the day on the floor of the New York Stock Exchange, November 18, 2013.Lucas Jackson/Reuters
The first half of 2017 is over, and it has been a roller coaster.
The news continued to be dominated by Donald Trump’s presidency, and all the proposed policies, tweets and leaks that have been happening since January. Investors are still wondering if the “Trump Trade” is impacting markets at all.
In the stock market, tech companies are the ones making headlines. The FAANG (Facebook, Amazon, Apple, Netflix, and Google) stocks have propelled the tech-heavy NASDAQ 100 to a gain that’s nearly twice as much as the S&P 500 or Dow.
There were a couple notable initial public offerings this year.
Snap went public in March, and things seemed to go well for the first day or two of trading. Shares peaked at $27.09 on the third day of trading, but recently hit their IPO price of $17.
More recently, Blue Apron IPOed, but it was overshadowed by Amazon’s $13.7 billion acquisition of Whole Foods, which sent waves across grocery, pharmacy and sporting goods companies. Blue Apron shares dipped below their $10 IPO price on just their second day of trading.
Commodities have been fairly unexciting. Gold and copper are up, but Oil is down. Disappointing OPEC cuts and rising supply out of the US sent oil careening toward $40 a barrel, but it has been marching higher of late.
In currencies, Brexit talks have pushed around the British pound, but it has ultimately made gains. The euro has risen as well.
As for cryptocurrencies, bitcoin is a whole other story, it’s up 285% this year. Nearly all major cryptocurrencies are growing, leading some to wonder what a cryptocurrency bubble might look like.
To celebrate the halfway point, and all that has happened thus far, Business Insider compiled 10 of the most important assets and grabbed a chart of each of their performances in 2017.
From bitcoin to the Dow, scroll down to find out which assets have grown, and which have fallen. Then check back at the end of the year to see how they did over the next six months.
All prices and charts are of 2 p.m. Friday, June 30th.


